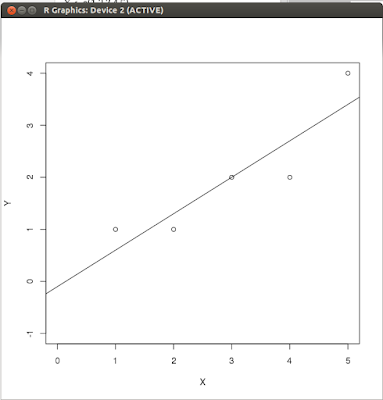
Y <- c(1,1,2,2,4)
X <- c(1,2,3,4,5)
fit <- lm(Y ~ X)
plot(X,Y,xlim=c(0,5),ylim=c(-1,4))
abline(fit)
> lm(Y ~ X)
Call:
lm(formula = Y ~ X)
Coefficients:
(Intercept) X
-0.1 0.7
> plot(X,Y,xlim=c(0,5),ylim=c(-1,4))
> abline(fit)

> summary(fit)
Call:
lm(formula = Y ~ X)
Residuals:
1 2 3 4 5
4.000e-01 -3.000e-01 -6.891e-17 -7.000e-01 6.000e-01
Coefficients:
Estimate Std. Error t value Pr(>|t|)
(Intercept) -0.1000 0.6351 -0.157 0.8849
X 0.7000 0.1915 3.656 0.0354 *
---
Signif. codes: 0 '***' 0.001 '**' 0.01 '*' 0.05 '.' 0.1 ' ' 1
Residual standard error: 0.6055 on 3 degrees of freedom
Multiple R-squared: 0.8167, Adjusted R-squared: 0.7556
F-statistic: 13.36 on 1 and 3 DF, p-value: 0.03535
Link used for reference:
Using R for Linear Regression<http://www.montefiore.ulg.ac.be/~kvansteen/GBIO0009-1/ac20092010/Class8/Using%20R%20for%20linear%20regression.pdf>
<http://www.statmethods.net/advgraphs/axes.html>
<http://www.dummies.com/
No comments:
Post a Comment