I was looking at the Maxima manual, and I had a "I wonder what this does" moment. It had to deal with Hilbert Maps, which may be found on Sourceforge at:
http://maxima.sourceforge.net/docs/manual/en/maxima_54.html#SEC268.
After I put in the two commands:
(%i1) load(fractals)$
(%i2) plot2d([discrete,hilbertmap(6)])$
into xMaxima I obtained this:

I was still not satisfied, so I did a quick Google search for Hilbert Maps. I clicked on one of the resulting images, and wound up here:
http://www.team-cymru.org/Monitoring/Malevolence/maps.html. This was all nice and good, but I wanted to know what Wikipedia said as well (
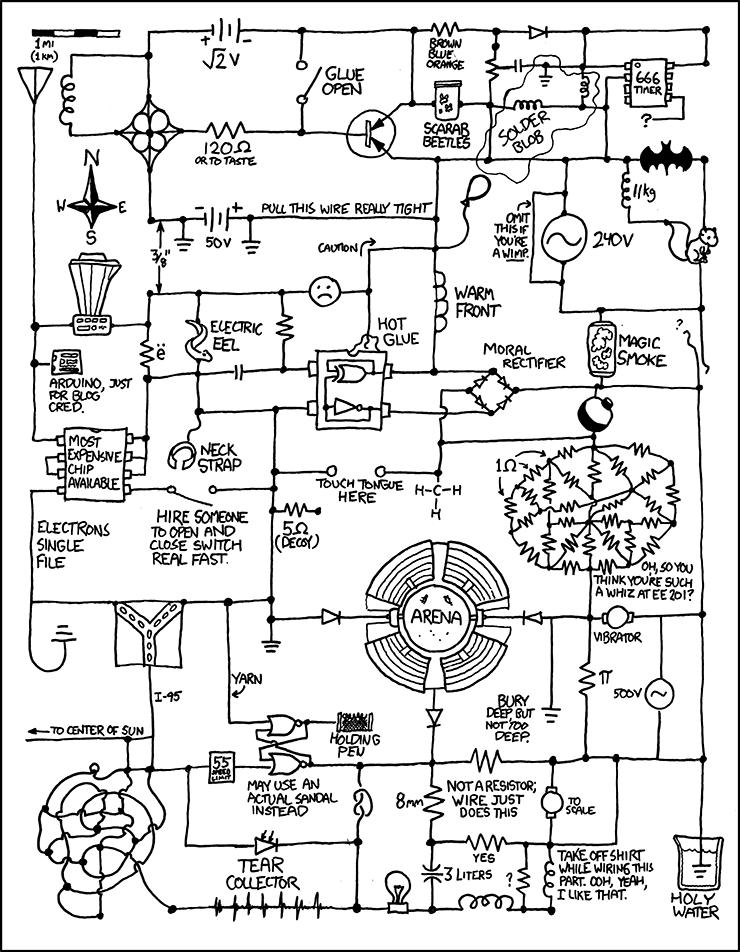
http://en.wikipedia.org/wiki/Hilbert_curve).This also led me to R-trees (http://en.wikipedia.org/wiki/R-tree) which remind me of network visualization, and Gray Codes which make me think of Minecraft. I performed a Google search for Hilbert Maps + Minecraft, and then a search for Minecraft + Gray Codes. This Youtube video by Neumann Gregor was an interesting result (http://www.youtube.com/watch?v=Y4ebK-qvAlk). Team Cymru also led me to xkcd, where I found a wonderful circuit diagram:
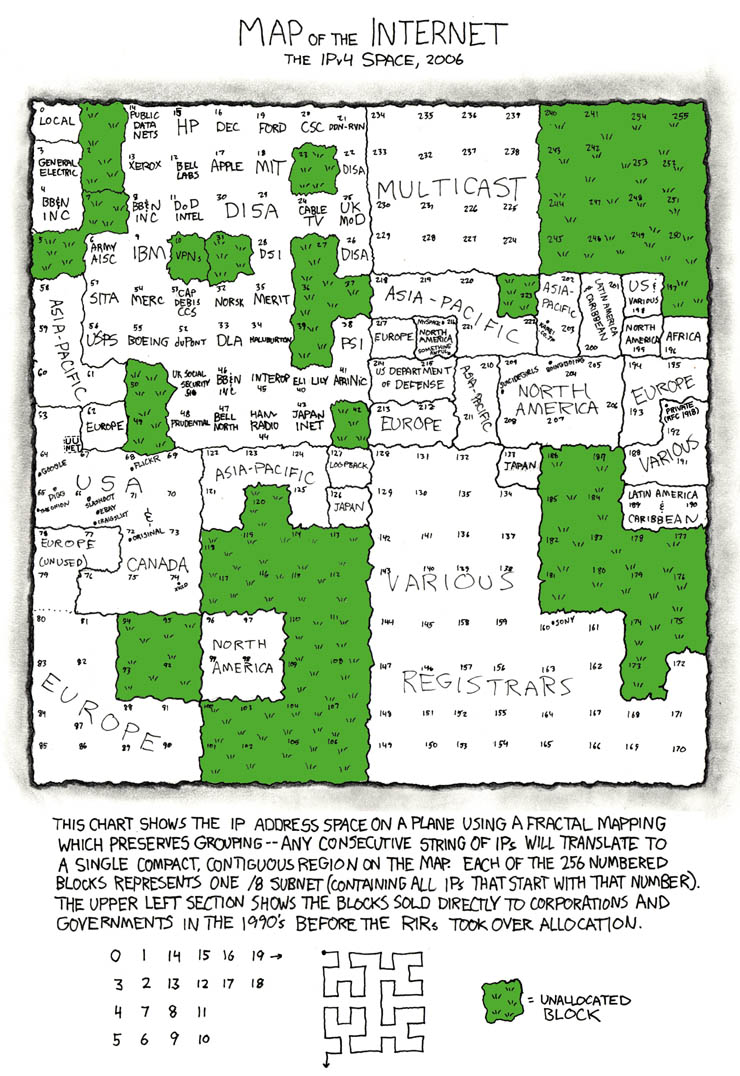
as well as a map of the IP4 space of the Internet:
Team Cymru was great because they also linked to The Measurement Factory at
http://www.measurement-factory.com/.
While there, I was interested in what CAIDA was. From the link (http://www.caida.org/home/), it turns out they are all about Internet Data Analysis.
 I was still not satisfied, so I did a quick Google search for Hilbert Maps. I clicked on one of the resulting images, and wound up here: http://www.team-cymru.org/Monitoring/Malevolence/maps.html. This was all nice and good, but I wanted to know what Wikipedia said as well (http://en.wikipedia.org/wiki/Hilbert_curve).This also led me to R-trees (http://en.wikipedia.org/wiki/R-tree) which remind me of network visualization, and Gray Codes which make me think of Minecraft. I performed a Google search for Hilbert Maps + Minecraft, and then a search for Minecraft + Gray Codes. This Youtube video by Neumann Gregor was an interesting result (http://www.youtube.com/watch?v=Y4ebK-qvAlk). Team Cymru also led me to xkcd, where I found a wonderful circuit diagram: